
Performance Data
Guidance for Provider Customer Service Program performance data.
The Centers for Medicare & Medicaid Services (CMS) administers and oversees the Provider Customer Service Program (PCSP) at the Medicare Administrative Contractors (MACs). CMS analyzes data to identify trends and make recommendations to improve the performance of the Medicare Fee-for-Service provider contact centers, the provider self-service technology options and to increase provider satisfaction.
Key performance measures for the previous 3 months are available below so MACs can measure their performance against the national data.
Provider Customer Service Program (PCSP): April 2022 – June 2022
Contact Center
| Metric | April 2022 | May 2022 | June 2022 |
|---|---|---|---|
| Average Speed of Answer (Seconds) | 37.9 | 36.3 | 51.1 |
| Average Talk Time (Minutes) | 6.7 | 6.7 | 6.7 |
| Completion Rate | 98.9% | 98.9% | 98.5% |
| IVR Handle Rate | 41.6% | 41.9% | 41.5% |
| IVR Transactions | 1,217,928 | 1,224,615 | 1,293,944 |
| Written Correspondence Received | 26,086 | 29,074 | 27,642 |
| Portal Transactions Received | 20,429,388 | 20,429,422 | 21,418,670 |
Provider Outreach and Education (POE)
| Metric | April 2022 | May 2022 | June 2022 |
|---|---|---|---|
| POE Events | 563 | 584 | 510 |
| POE Events (Attendees) | 25,419 | 30,460 | 16,031 |
| Self-Paced Education (Occurrences) | 1,801 | 1,843 | 1,824 |
| Self-Paced Education (Clicks) | 818,343 | 763,999 | 797,125 |
Quality
| Metric | April 2022 | May 2022 | June 2022 |
|---|---|---|---|
| Quality Assurance Monitoring (QAM) | 99% | 98% | 97% |
| QCM (Privacy Act) | 98% | 97% | 97% |
| QCM (Knowledge Skills) | 95% | 95% | 95% |
| QCM (Customer Skills) | 99% | 99% | 99% |
| QWCM (Privacy Act) | 100% | 99% | 100% |
| QWCM (Knowledge Skills) | 99% | 99% | 97% |
| QWCM (Customer Skills) | 100% | 100% | 100% |
Telecom Performance (April 2022 - June 2022)
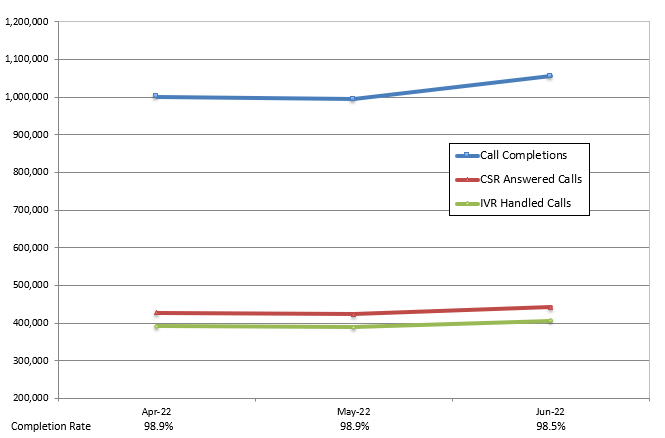
Provider Inquiries (April 2022 - June 2022)
Top 5 Subcategories - Telephone Inquiries
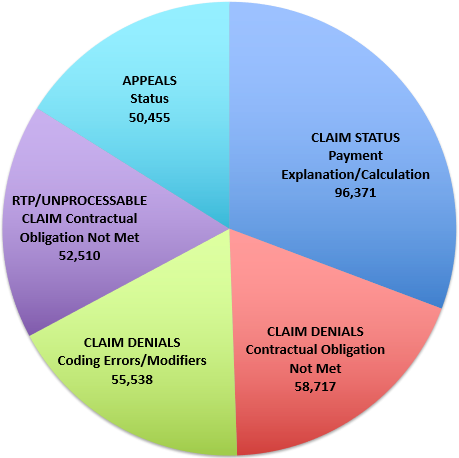
Total CSR Telephone Inquiries: 1,384,071
Top 5 Subcategories - Written Inquiries
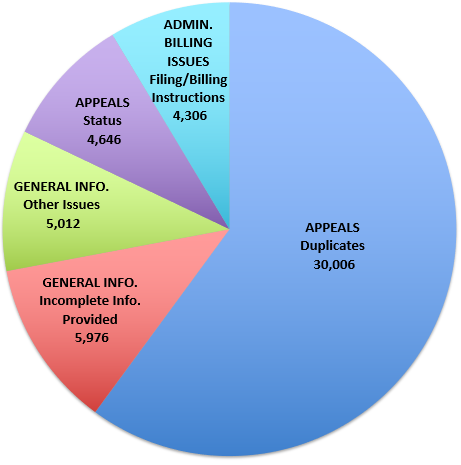
Total Written Inquiries: 98,758
Each CSR call or written correspondence may cover one or more inquiries.
Provider Outreach and Education (April 2022 - June 2022)
Top 5 POE Subtopics
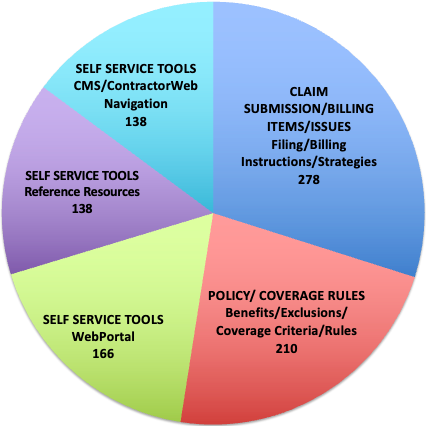
Total POE Events: 1,657
Each event may cover one or more subtopics.
Issued by: Centers for Medicare & Medicaid Services (CMS)
Issue Date: December 02, 2019
HHS is committed to making its websites and documents accessible to the widest possible audience, including individuals with disabilities. We are in the process of retroactively making some documents accessible. If you need assistance accessing an accessible version of this document, please reach out to the guidance@hhs.gov.
DISCLAIMER: The contents of this database lack the force and effect of law, except as authorized by law (including Medicare Advantage Rate Announcements and Advance Notices) or as specifically incorporated into a contract. The Department may not cite, use, or rely on any guidance that is not posted on the guidance repository, except to establish historical facts.