
Numbers at a Glance June 2008
This is a series of tables and charts summarizing OCR's HIPAA compliance workloads as of June 2008. The target audience is health care professionals.
Final
Issued by: Office for Civil Rights (OCR)
Issue Date: June 30, 1905
Numbers at a Glance
(As of June 30, 2008)
Topics on this page:
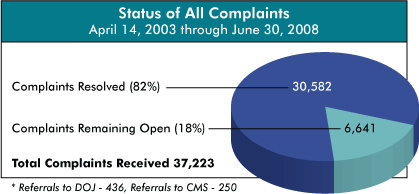
Status of All Complaints
|
Complaints Remaining Open |
6,641 |
18% of Total |
|
Complaints Resolved |
30,582 |
82% of Total |
|
Total Complaints Received |
37,223 |
|
|---|
* Referrals to DOJ - 436, Referrals to CMS - 250
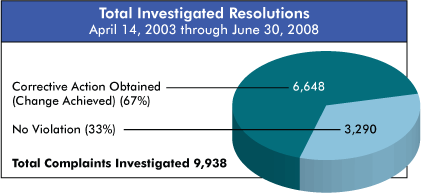
Total Investigated Resolutions
|
Corrective Action Obtained (Change Achieved) |
6,648 |
67% of Total |
|
No Violation |
3,290 |
33% of Total |
|
Total Complaints Investigated |
9,938 |
|
|---|
Enforcement Highlights and Numbers at a Glance
HHS is committed to making its websites and documents accessible to the widest possible audience, including individuals with disabilities. We are in the process of retroactively making some documents accessible. If you need assistance accessing an accessible version of this document, please reach out to the guidance@hhs.gov.
DISCLAIMER: The contents of this database lack the force and effect of law, except as authorized by law (including Medicare Advantage Rate Announcements and Advance Notices) or as specifically incorporated into a contract. The Department may not cite, use, or rely on any guidance that is not posted on the guidance repository, except to establish historical facts.