
Numbers at a Glance August 2014
This is HIPAA enforcement numbers at a glace for 2014
Final
Issued by: Office for Civil Rights (OCR)
Issue Date: July 06, 1905
Numbers at a Glance
(As of August 31, 2014)
Topics on this page:
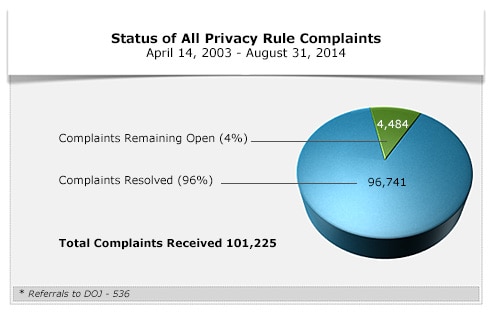
| Status of All Privacy Rule Complaints | ||
|---|---|---|
| Complaints Remaining Open | 4,484 | 4% of Total |
| Complaints Resolved | 96,741 | 96% of Total |
| Total Complaints Received | 101,225 | |
* Referrals to DOJ - 530
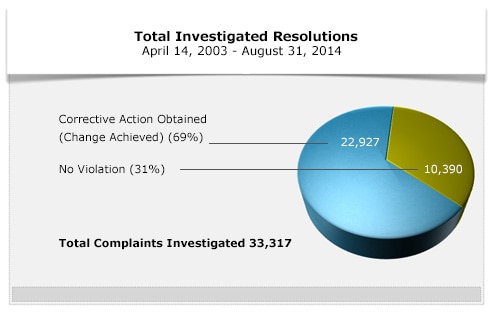
| Total Investigated Resolutions | ||
|---|---|---|
| Corrective Action Obtained (Change Achieved) | 22,927 | 69% of Total |
| No Violation | 10,390 | 31% of Total |
| Total Complaints Investigated | 33,317 |
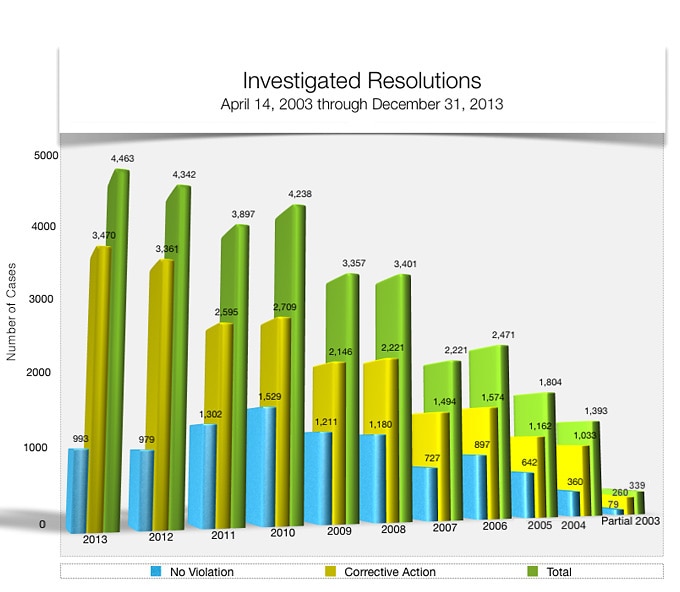
This bar graph shows a comparison of the complaints that OCR has investigated and resolved by calendar year according to the type of closure, and includes a bar reflecting the total closures. The first bar in the group of three per year represents the complaints closed in which there was no violation, the second in which there was corrective action, and the third reflects the total closures.
|
YEAR |
NO VIOLATION |
CORRECTIVE ACTION |
TOTAL |
|
Partial Year 2003 |
79 |
260 |
339 |
|
2004 |
360 |
1033 |
1393 |
|
2005 |
642 |
1162 |
1804 |
|
2006 |
897 |
1574 |
2471 |
|
2007 |
727 |
1494 |
2221 |
|
2008 |
1180 |
2221 |
3401 |
|
2009 |
1211 |
2146 |
3357 |
|
2010 |
1529 |
2709 |
4238 |
|
2011 |
1302 |
2595 |
3897 |
|
2012 |
979 |
3361 |
4340 |
|
2013 |
993 |
3470 |
4463 |
Enforcement Highlights and Numbers at a Glance
- Current Enforcement Highlights
- Enforcement Highlights Archived by Month
- Enforcement Data by Calendar Year
- Current Numbers at a Glance
- Numbers at a Glance Archive
Numbers at a Glance
(As of August 31, 2014)
Topics on this page:
Status of All Privacy Rule Complaints Complaints Remaining Open 4,484 4% of Total Complaints Resolved 96,741 96% of Total Total Complaints Received 101,225 * Referrals to DOJ - 530
Total Investigated Resolutions Corrective Action Obtained (Change Achieved) 22,927 69% of Total No Violation 10,390 31% of Total Total Complaints Investigated 33,317
This bar graph shows a comparison of the complaints that OCR has investigated and resolved by calendar year according to the type of closure, and includes a bar reflecting the total closures. The first bar in the group of three per year represents the complaints closed in which there was no violation, the second in which there was corrective action, and the third reflects the total closures.
YEAR
NO VIOLATION
CORRECTIVE ACTION
TOTAL
Partial Year 2003
79
260
339
2004
360
1033
1393
2005
642
1162
1804
2006
897
1574
2471
2007
727
1494
2221
2008
1180
2221
3401
2009
1211
2146
3357
2010
1529
2709
4238
2011
1302
2595
3897
2012
979
3361
4340
2013
993
3470
4463
Enforcement Highlights and Numbers at a Glance
HHS is committed to making its websites and documents accessible to the widest possible audience, including individuals with disabilities. We are in the process of retroactively making some documents accessible. If you need assistance accessing an accessible version of this document, please reach out to the guidance@hhs.gov.
DISCLAIMER: The contents of this database lack the force and effect of law, except as authorized by law (including Medicare Advantage Rate Announcements and Advance Notices) or as specifically incorporated into a contract. The Department may not cite, use, or rely on any guidance that is not posted on the guidance repository, except to establish historical facts.