
Enforcement Results by Year
This is an overview of OCR's HIPAA enforcement results by calendar year according to the type of closure for each category. It is for covered entities and other stakeholders.
Final
Issued by: Office for Civil Rights (OCR)
Issue Date: July 12, 1905
Enforcement Results by Year
The data table below shows the enforcement results by calendar year according to the type of closure for each category. This is the number of investigations that OCR had resolved. There were:
Outcome of Complaint Investigations
| Resolved After Intake and Review |
Technical Assistance |
Investigated: No Violation |
Post-Investigational Technical Assistance |
Investigated: Corrective Action Obtained |
Total Resolutions | |
|---|---|---|---|---|---|---|
| 2015 | 12713 | 3817 | 360 | 188 | 542 | 17620 |
| 2016 | 16788 | 6201 | 204 | 231 | 476 | 23900 |
| 2017 | 15270 | 7307 | 253 | 219 | 668 | 23717 |
| 2018 | 16989 | 6912 | 267 | 289 | 632 | 25089 |
| 2019 | 19584 | 8770 | 444 | 252 | 803 | 29853 |
Outcome of Breach Compliance Review Investigations
| Resolved After Intake and Review |
Investigated: No Violation |
Post-Investigational Technical Assistance |
Investigated: Corrective Action Obtained |
Other | Total Resolutions | |
|---|---|---|---|---|---|---|
| 2015 | 6 | 8 | 2 | 119 | 5 | 140 |
| 2016 | 8 | 25 | 26 | 257 | 3 | 319 |
| 2017 | 9 | 25 | 24 | 307 | 6 | 371 |
| 2018 | 10 | 15 | 41 | 359 | 6 | 431 |
| 2019 | 5 | 22 | 36 | 235 | 0 | 298 |
Outcome of Other Compliance Review Investigations
| Resolved After: Intake and Review |
Investigated: No Violation |
Post-Investigational Technical Assistance |
Investigated: Corrective Action Obtained |
Other | Total Resolutions | |
|---|---|---|---|---|---|---|
| 2015 | 2 | 7 | 1 | 23 | 3 | 36 |
| 2016 | 1 | 3 | 0 | 10 | 1 | 15 |
| 2017 | 0 | 4 | 9 | 5 | 7 | 25 |
| 2018 | 0 | 2 | 1 | 4 | 0 | 7 |
| 2019 | 0 | 21 | 2 | 17 | 0 | 40 |
Total Cases Investigated
| Investigated: No Violation |
Post-Investigational: Technical Assistance |
Investigated: Corrective Action Obtained |
Total Investigated | Of Those, Settlements or CMPs | % of Total Investigated | |
|---|---|---|---|---|---|---|
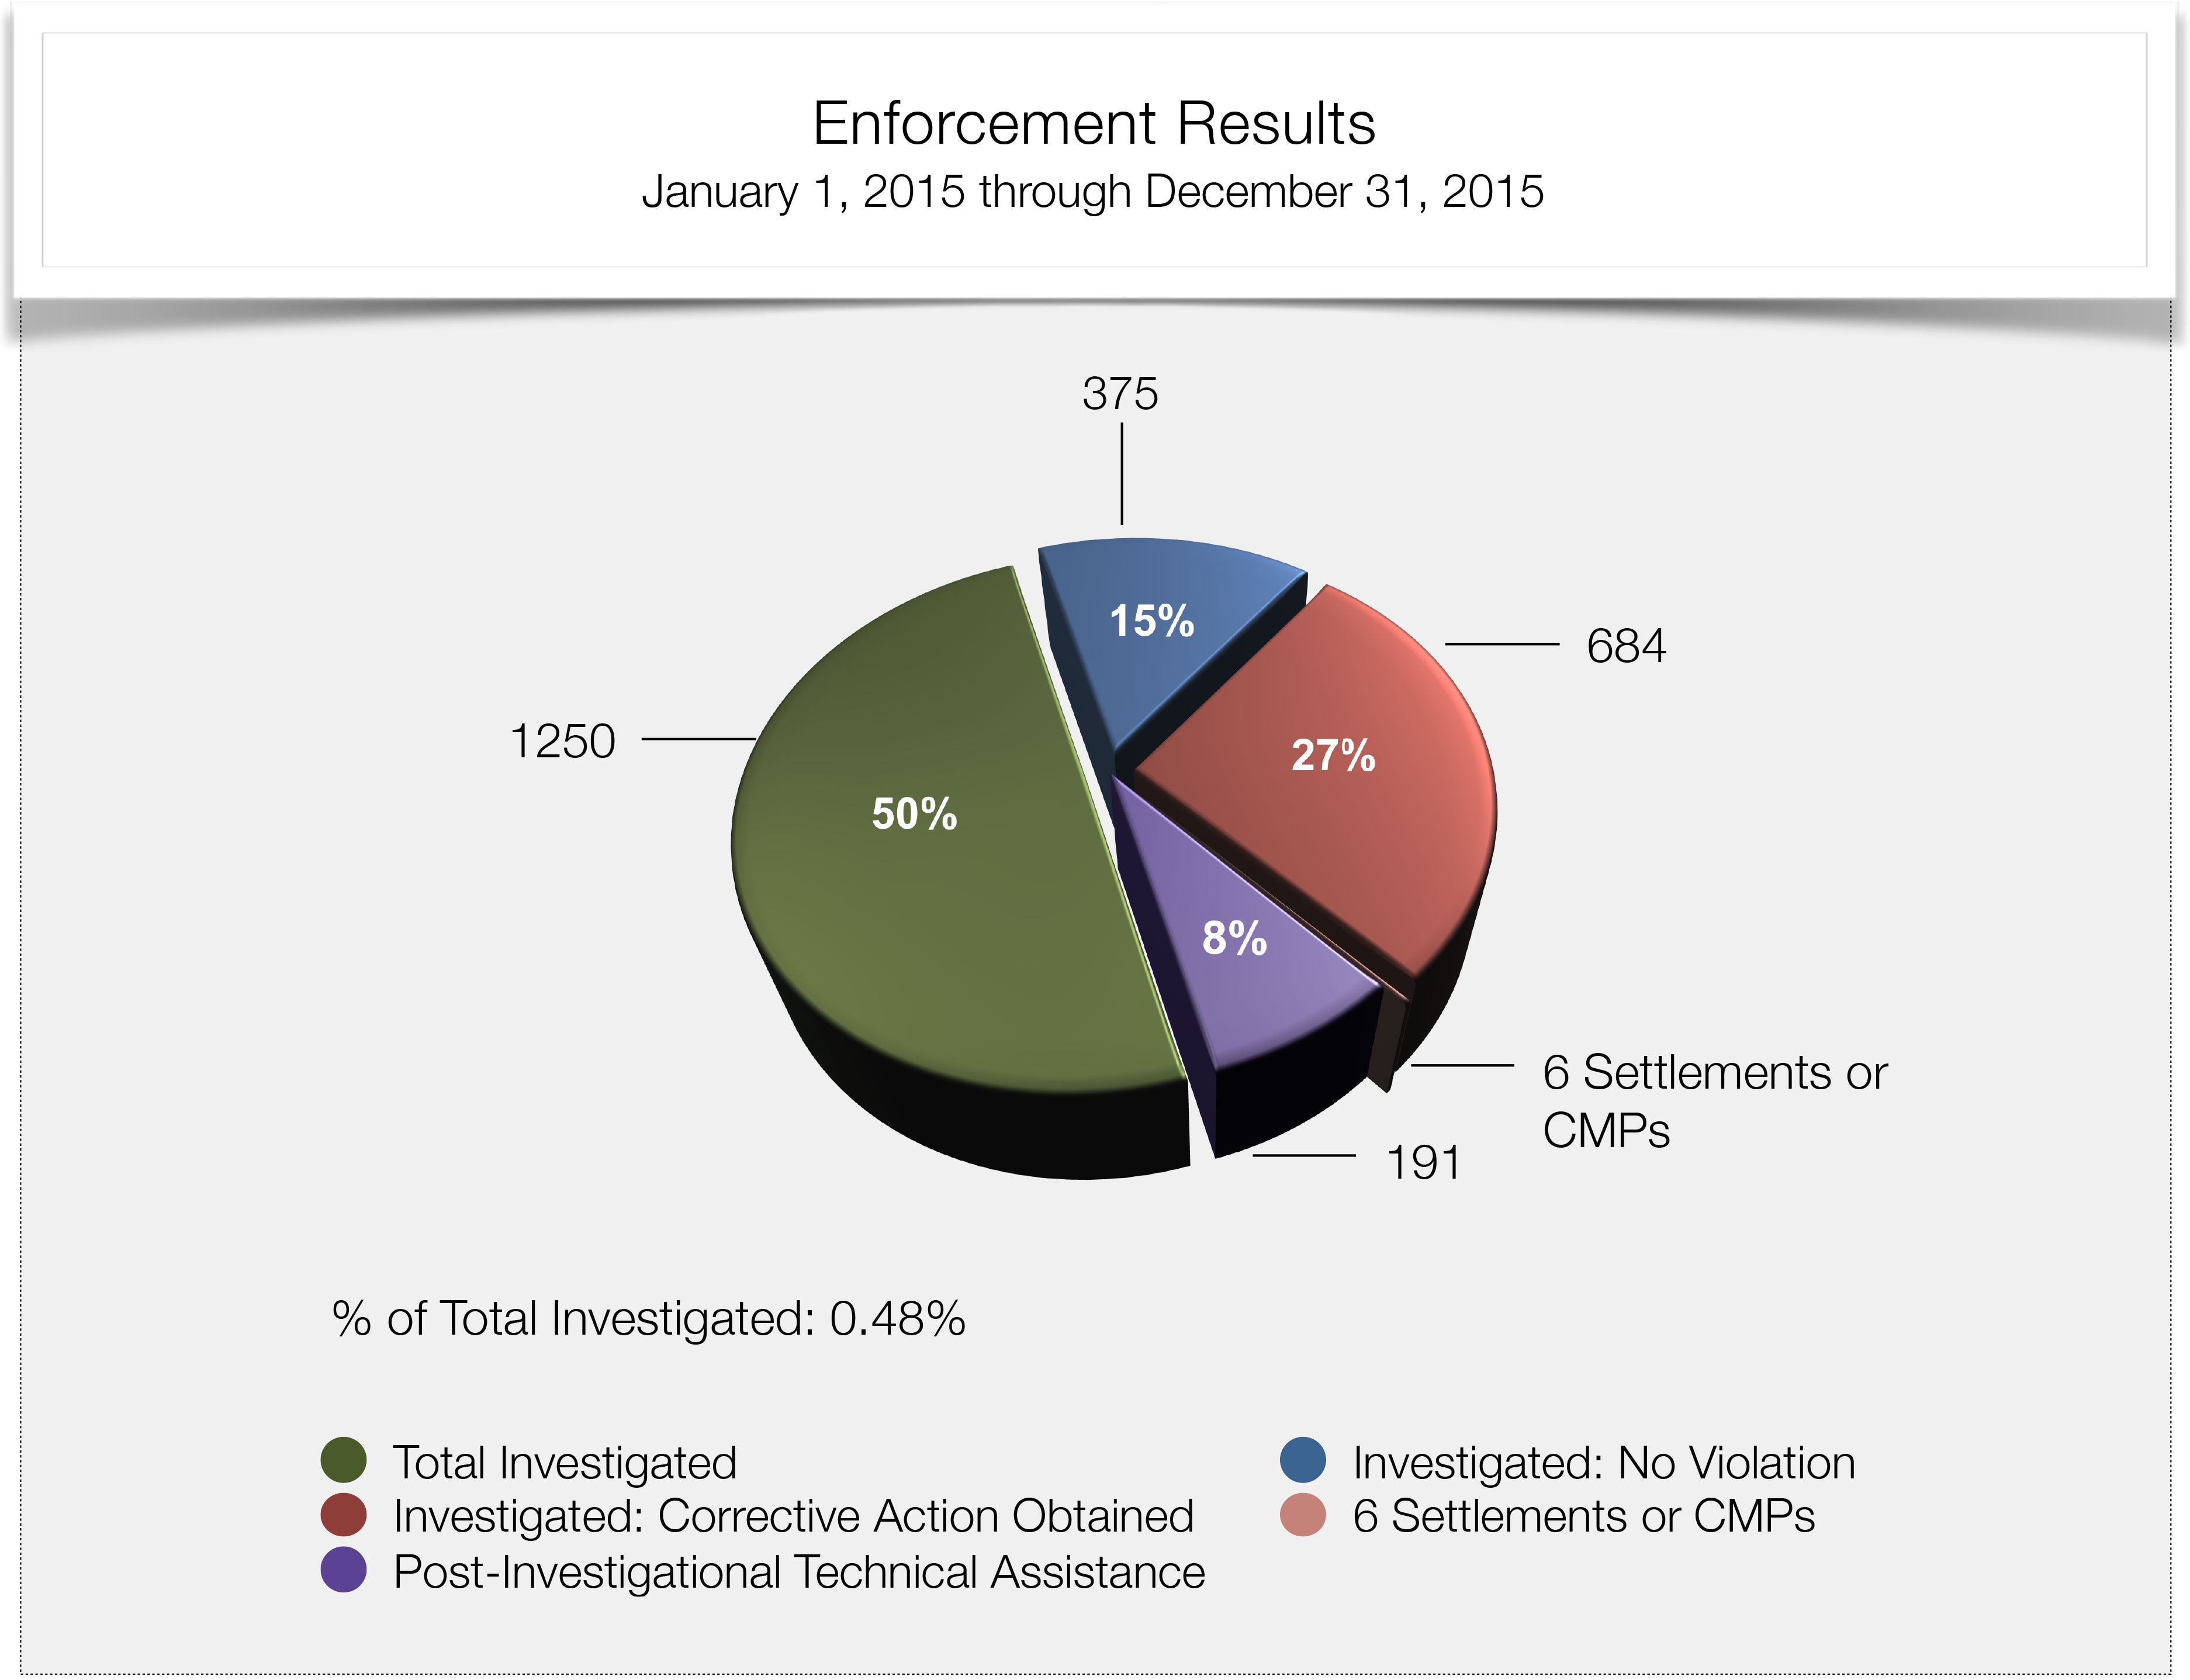
| 2015 | 375 | 191 | 684 | 1250 | 6 | 0.48% |
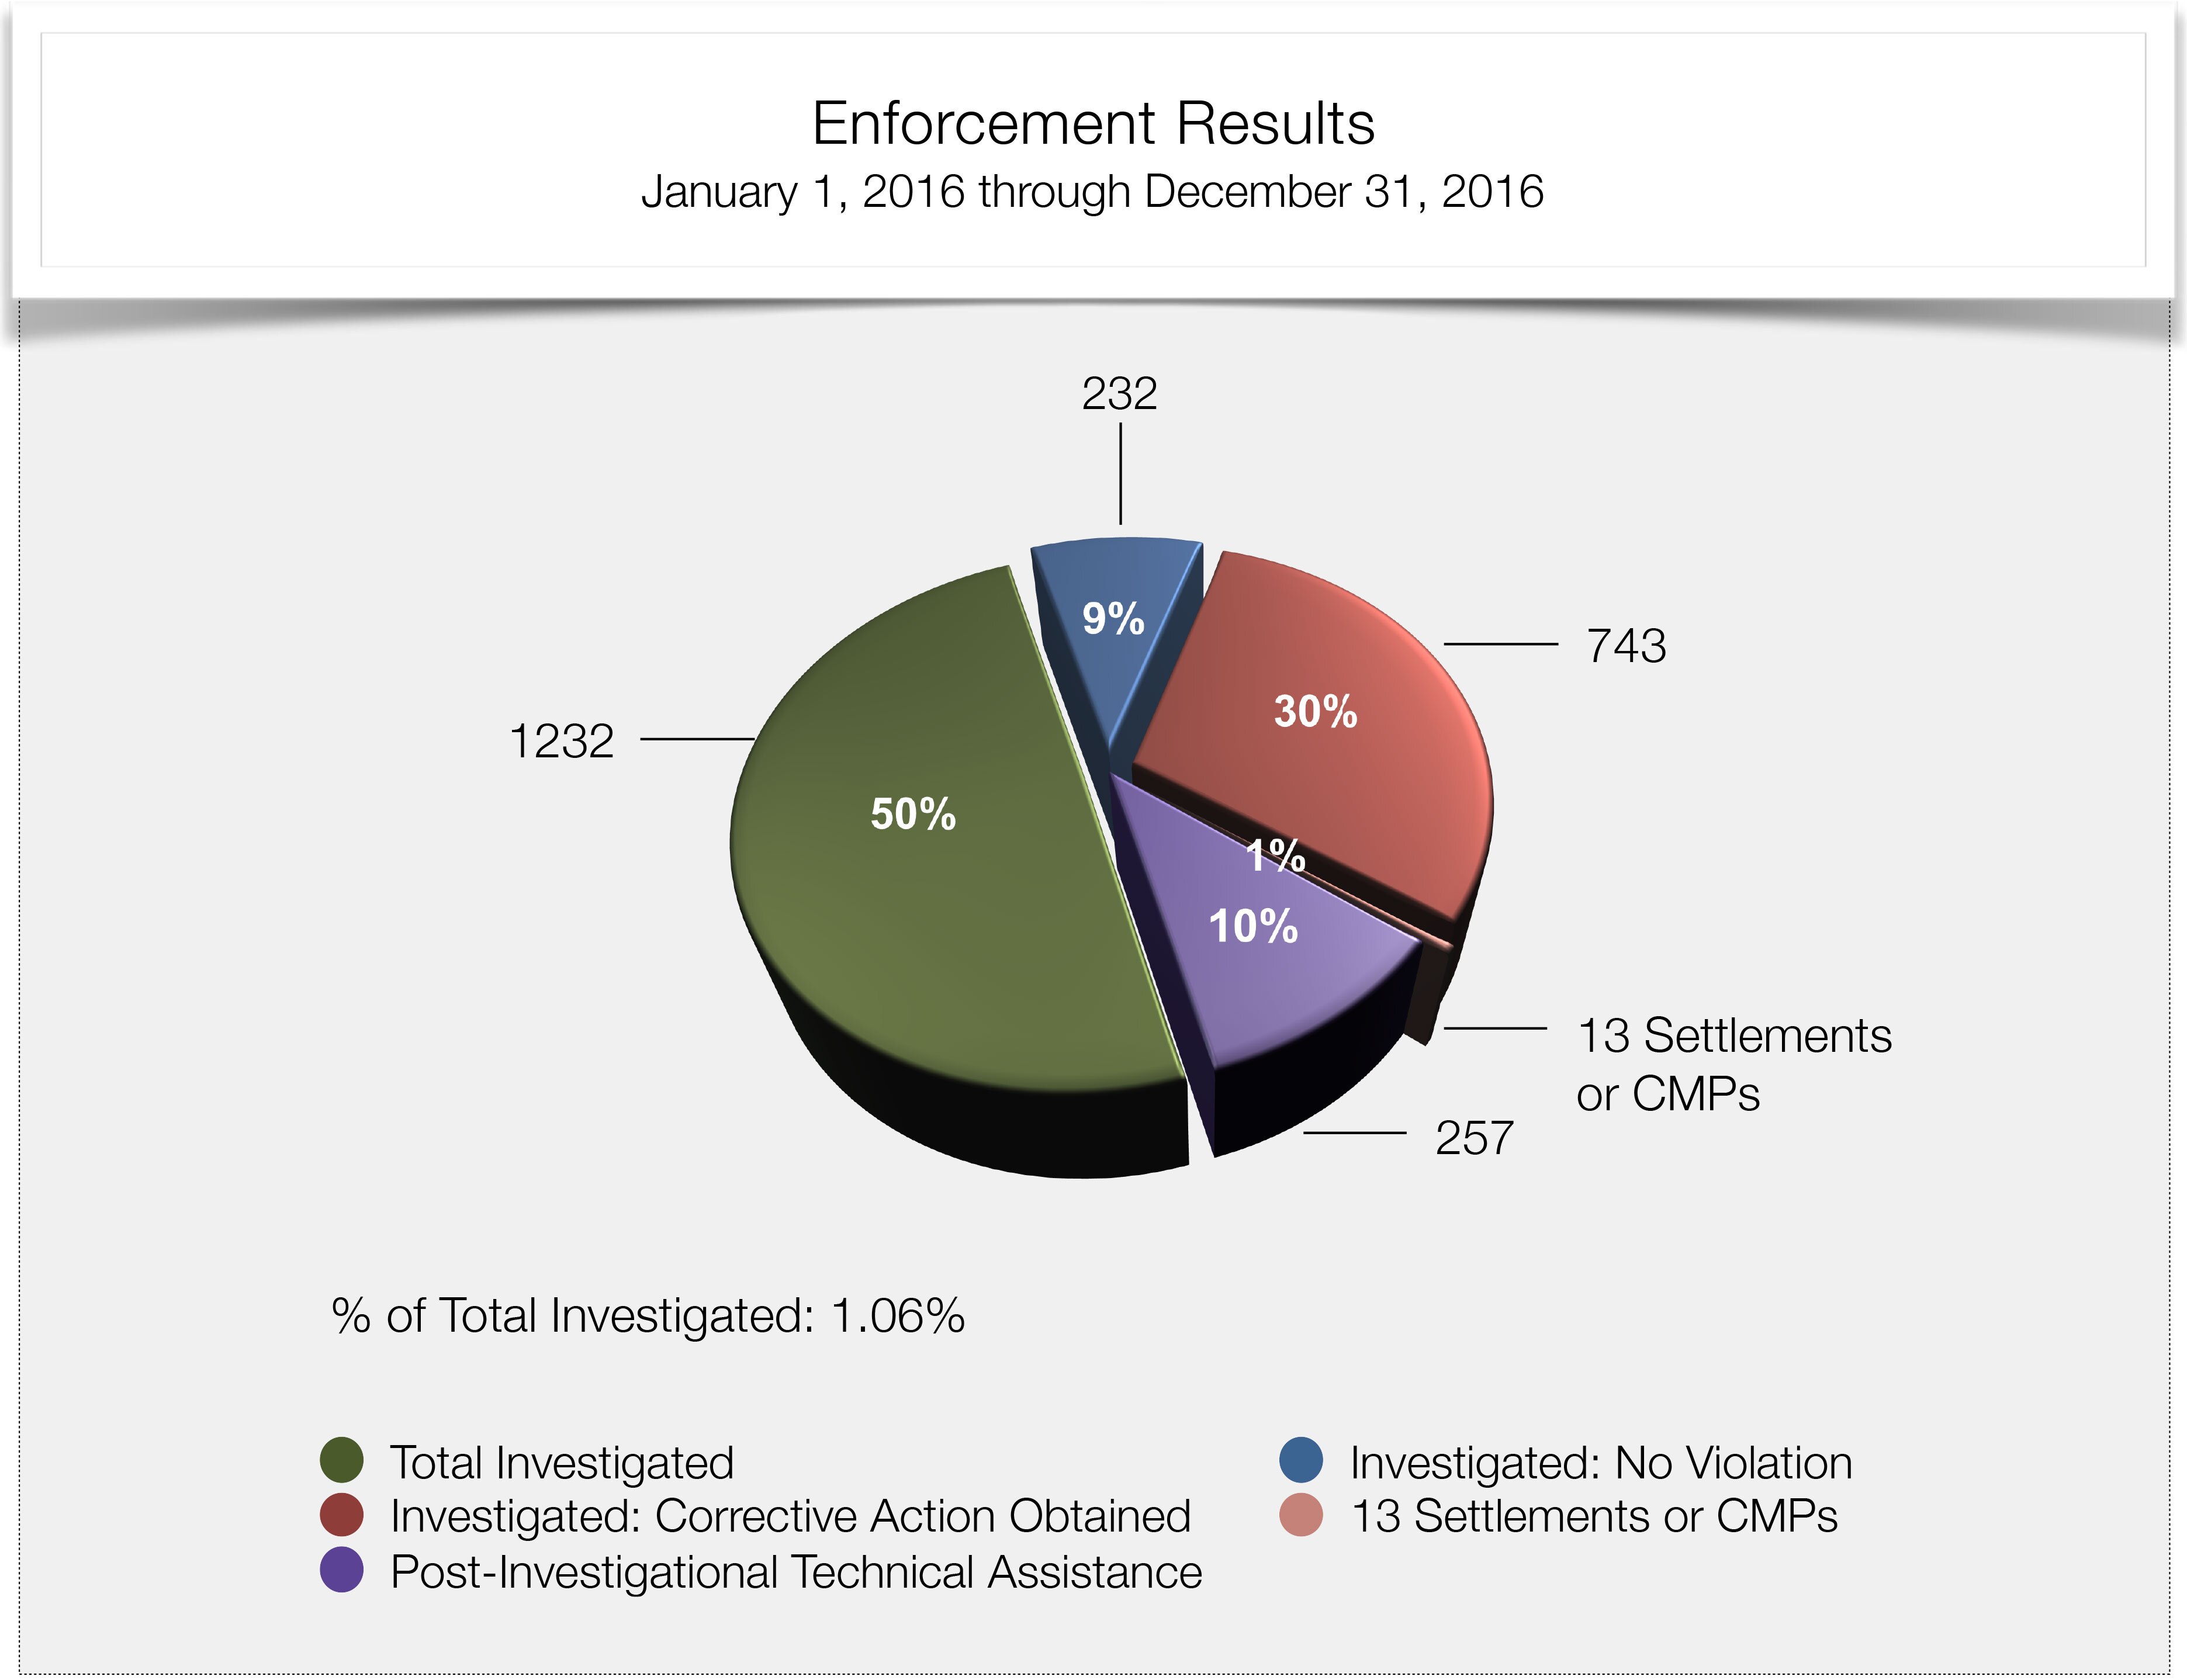
| 2016 | 232 | 257 | 743 | 1232 | 13 | 1.06% |
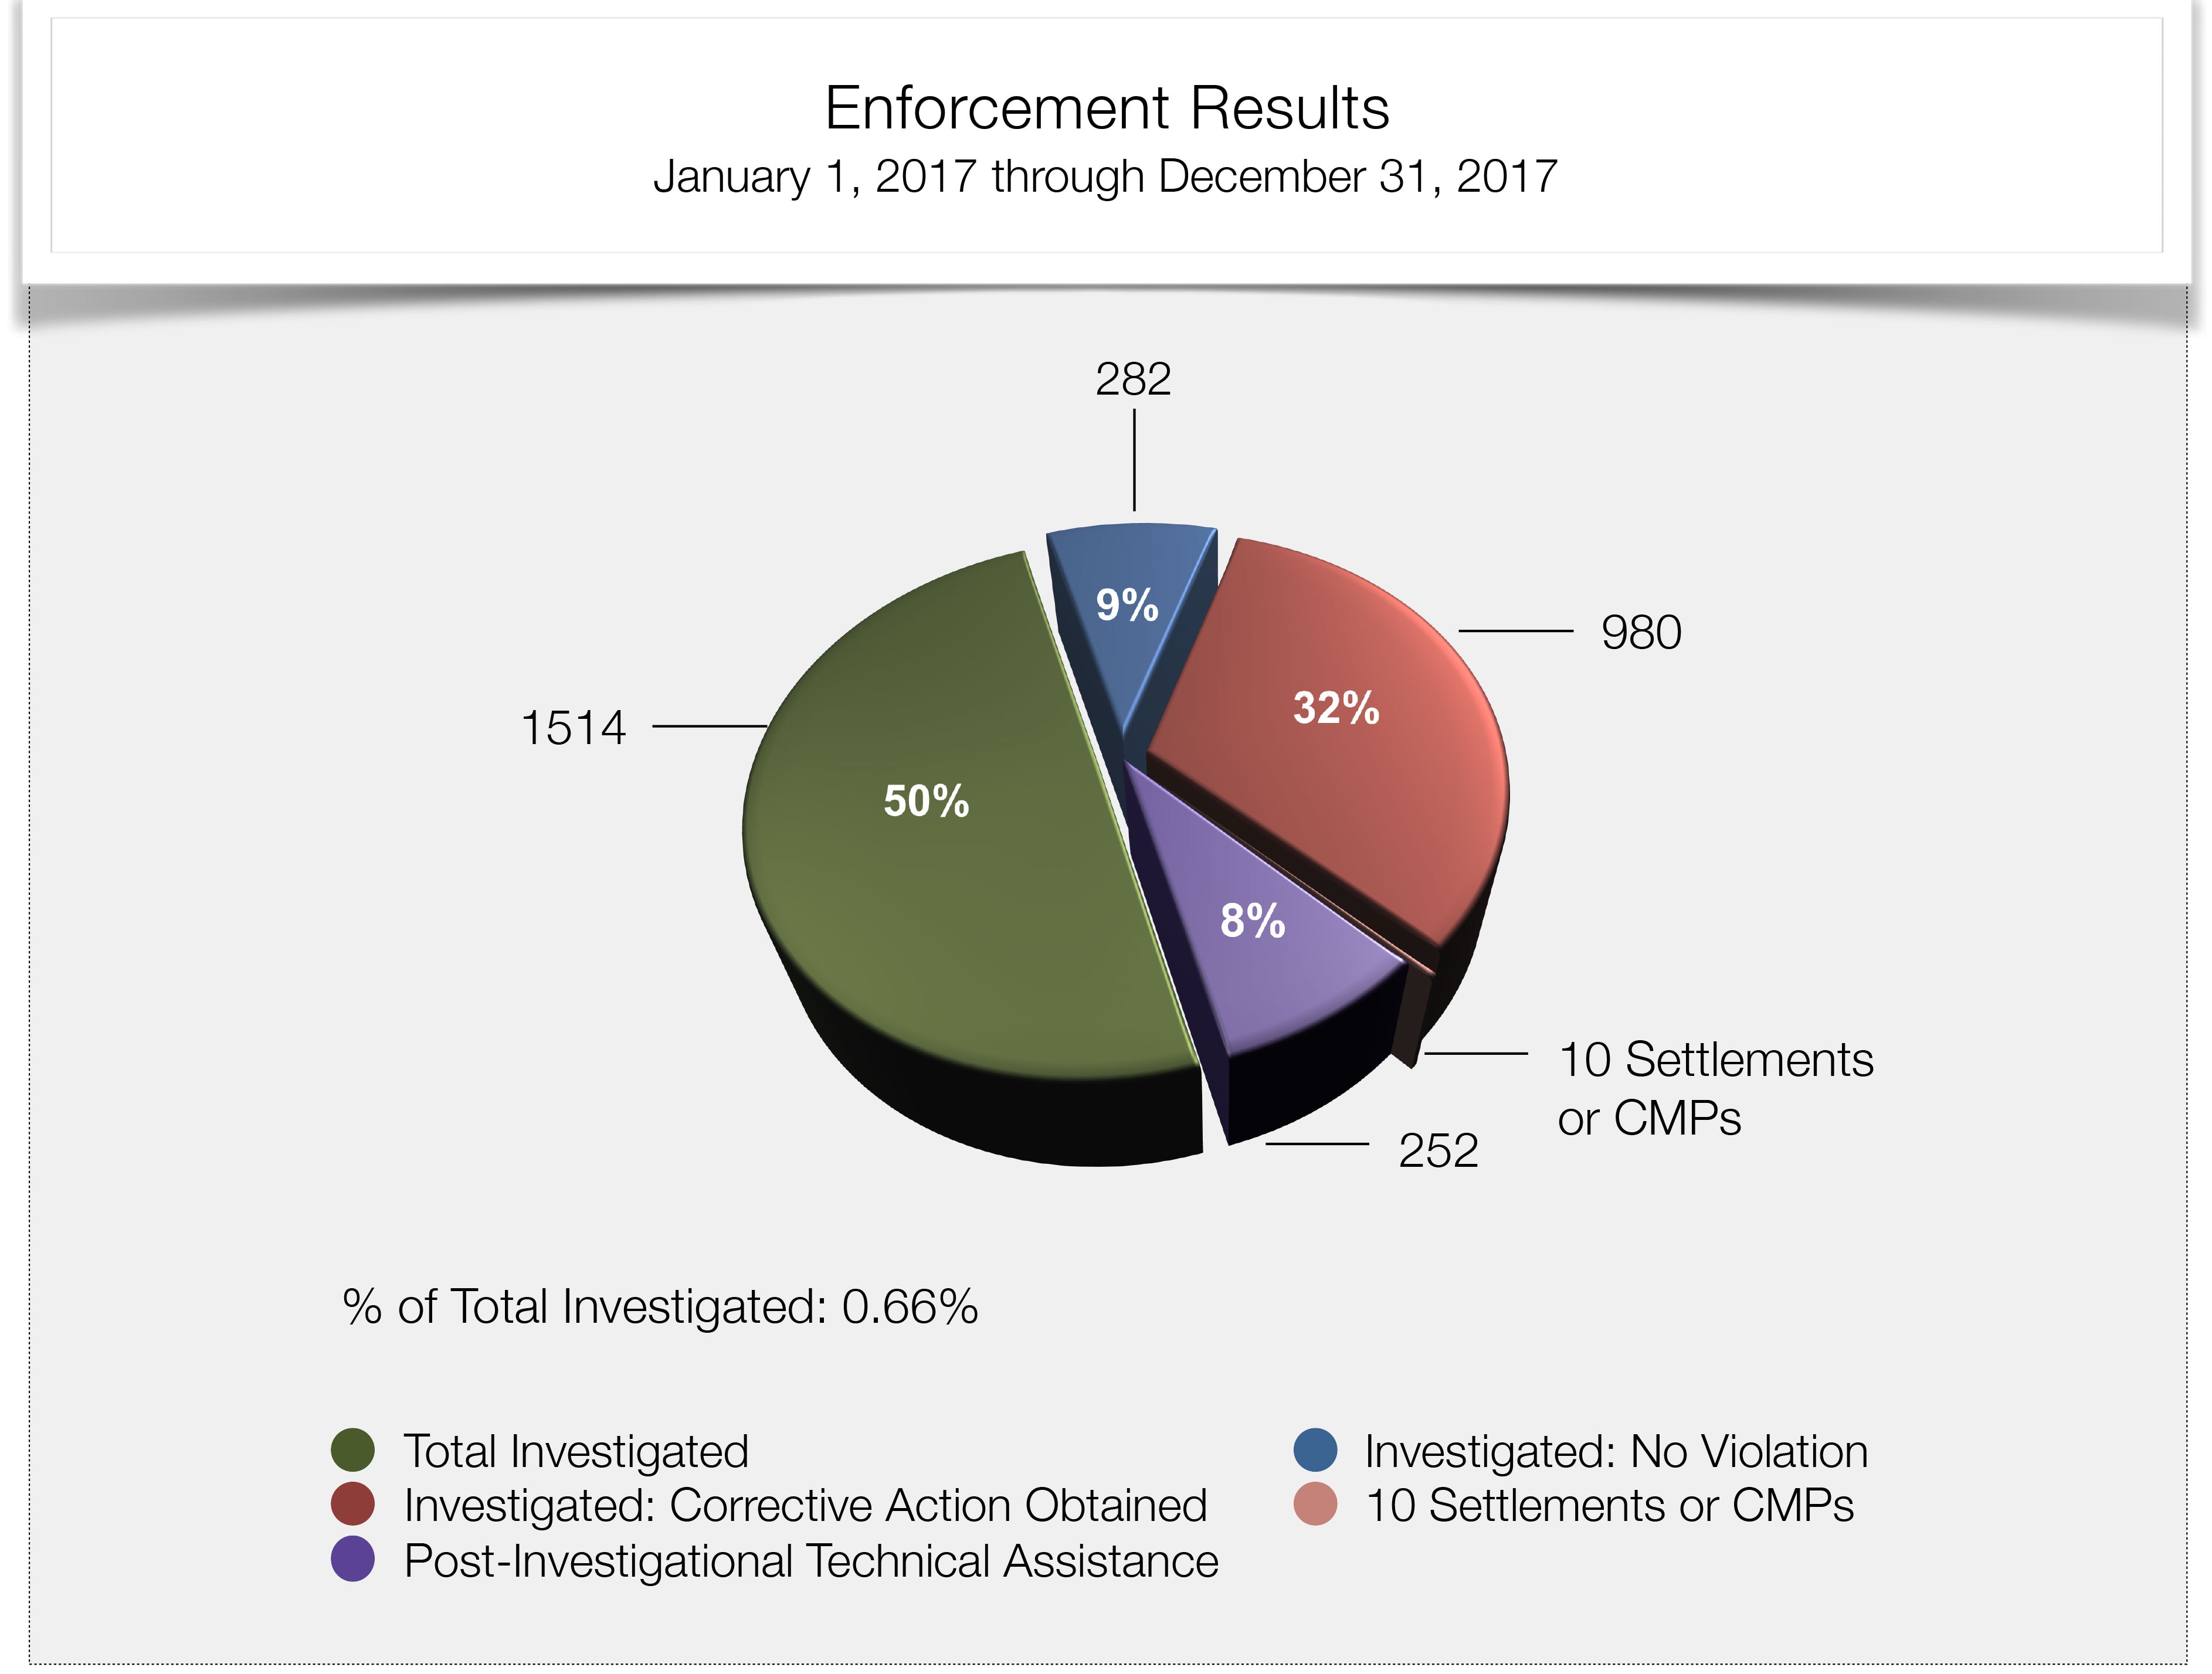
| 2017 | 282 | 252 | 980 | 1514 | 10 | 0.66% |
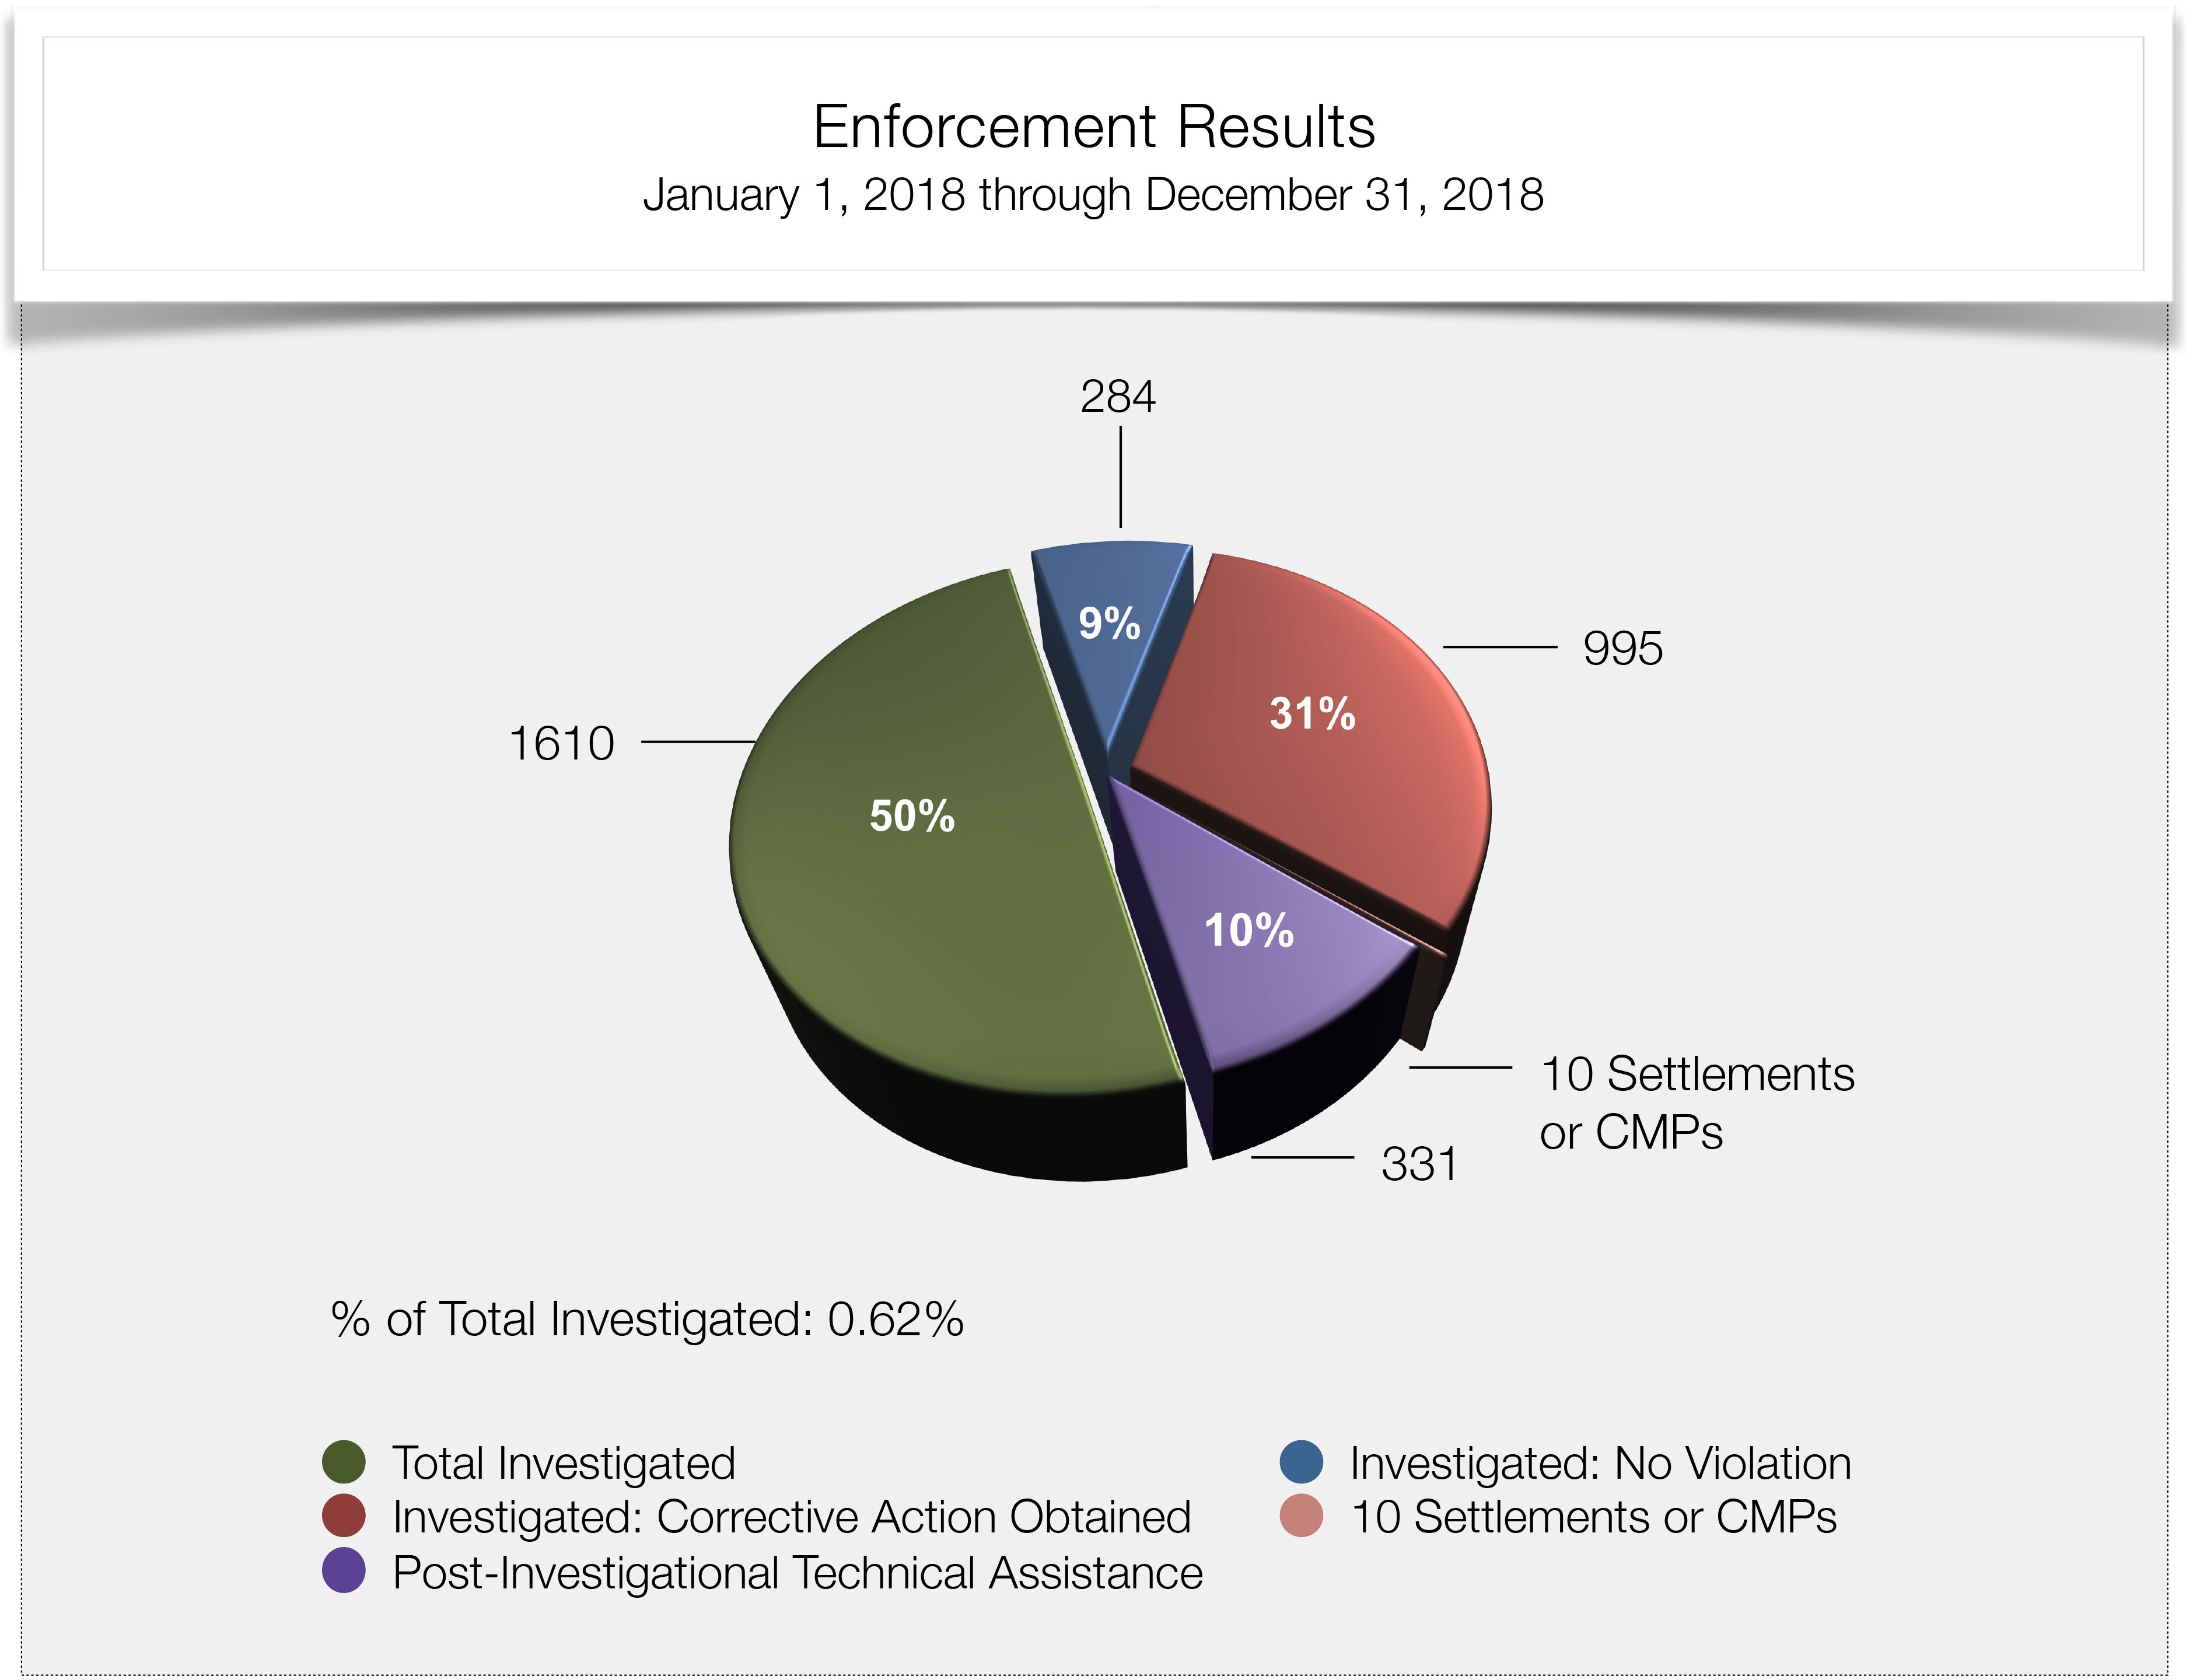
| 2018 | 284 | 331 | 995 | 1610 | 10 | 0.62% |
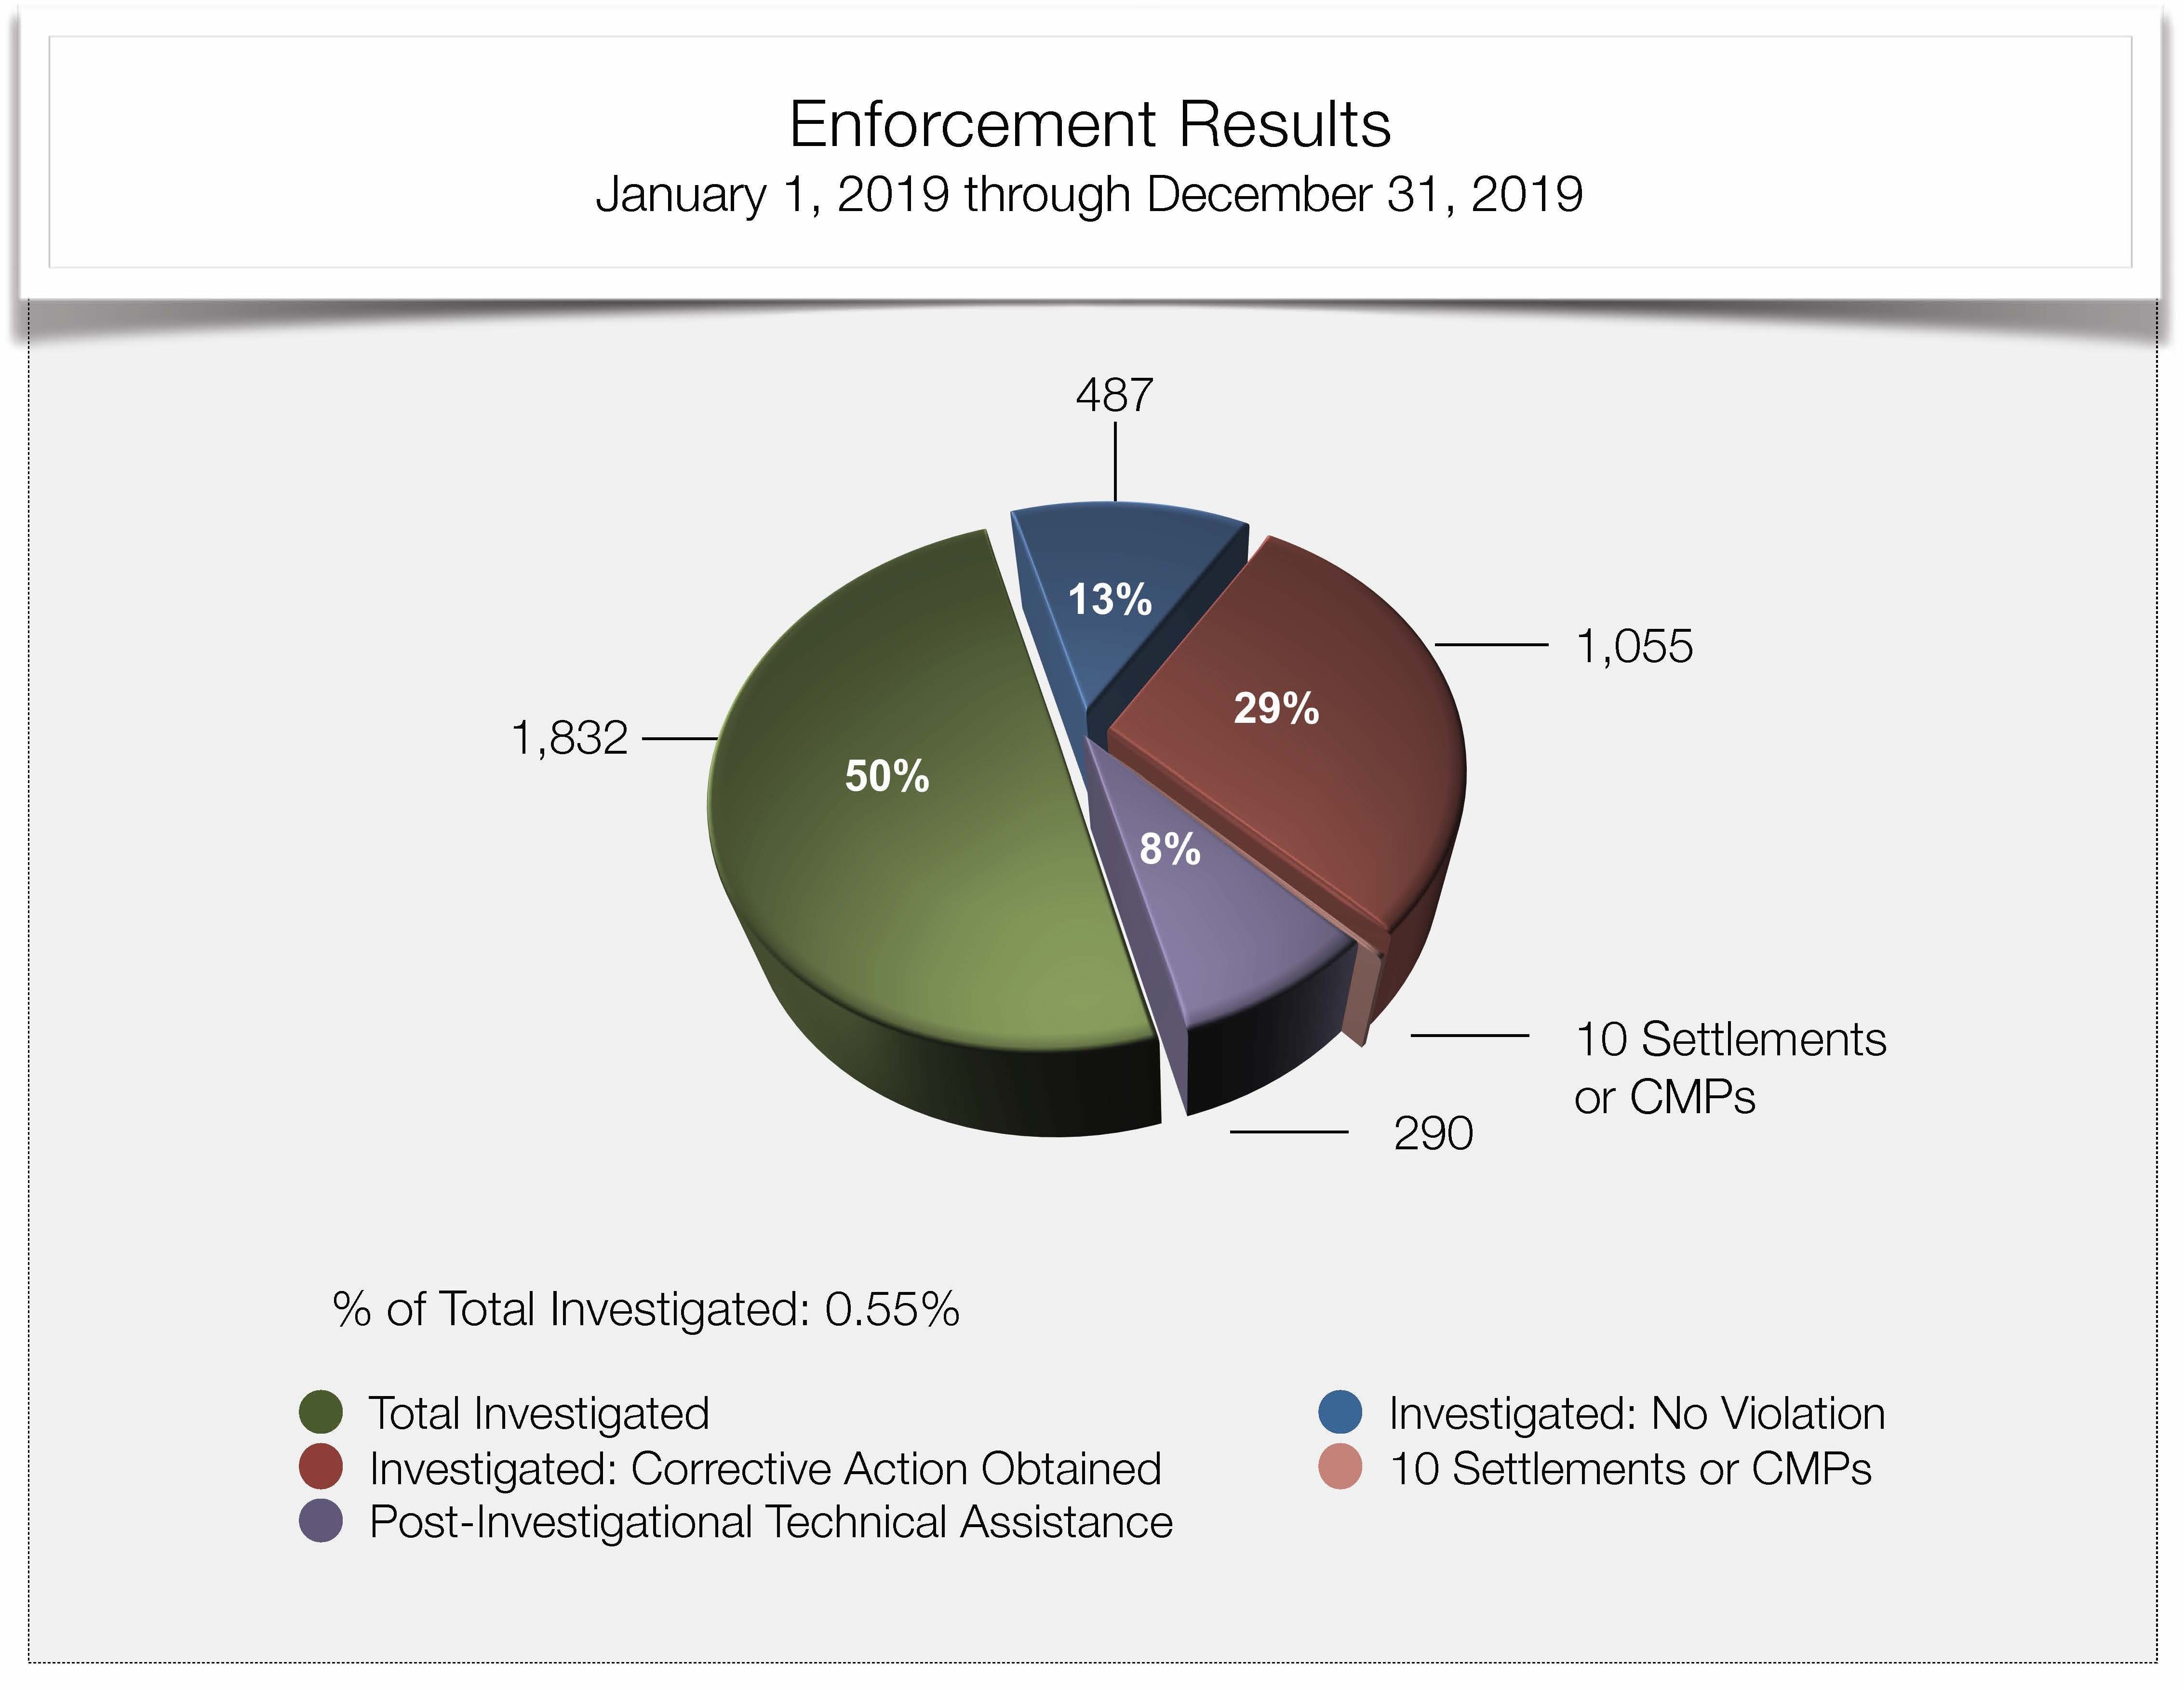
| 2019 | 487 | 290 | 1055 | 1832 | 10 | 0.55% |
Total Cases
| Complaints | Compliance Reviews | Technical Assistance | Total Cases | Of Those, Settlements or CMPs | % of Total Cases | |
|---|---|---|---|---|---|---|
| 2015 | 17620 | 176 | 4008 | 21804 | 6 | 0.0275% |
| 2016 | 23900 | 334 | 6458 | 30692 | 13 | 0.0424% |
| 2017 | 23717 | 396 | 7559 | 31672 | 10 | 0.0316% |
| 2018 | 25089 | 438 | 7243 | 32770 | 10 | 0.0305% |
| 2019 | 29853 | 338 | 9060 | 39251 | 10 | 0.0255% |
Enforcement Results, Pie Chart by Year:
- Investigations Resolved: January 1, 2019 - December 31, 2019
- Investigations Resolved: January 1, 2018 - December 31, 2018
- Investigations Resolved: January 1, 2017 - December 31, 2017
- Investigations Resolved: January 1, 2016 - December 31. 2016
- Investigations Resolved: January 1, 2015 - December 31, 2015
HHS is committed to making its websites and documents accessible to the widest possible audience, including individuals with disabilities. We are in the process of retroactively making some documents accessible. If you need assistance accessing an accessible version of this document, please reach out to the guidance@hhs.gov.
DISCLAIMER: The contents of this database lack the force and effect of law, except as authorized by law (including Medicare Advantage Rate Announcements and Advance Notices) or as specifically incorporated into a contract. The Department may not cite, use, or rely on any guidance that is not posted on the guidance repository, except to establish historical facts.